

Introduction |
Report IntroductionThis Florida Geological Survey (FGS) / National Oceanographic and Atmospheric Administration (NOAA) Cooperative Study characterizes sampled sediments from the beaches of Escambia, Santa Rosa, Okaloosa, Walton, Bay, Gulf, Franklin, Wakulla, Taylor, Dixie, Levy, Citrus, Hernando, Pasco and Pinellas counties. The study area thus encompasses the northwest coast and Big Bend of Florida. The study area extends from the Alabama/Florida state line in the west and proceeds eastward and then southward to Anclote Key in extreme northern Pinellas County. See Figure 1 for a reference map which ties the study area to the remainder of Florida. Specific reaches of beach as defined by geographic boundaries, i.e. the mouths of rivers and inlets, are discussed in this report. While the sampling of beaches along the northwest coast and Big Bend of Florida was done on a county by county basis, beach boundaries on the northwest coast are delineated in the report by reaches defined by geographic features. The delineating features, inlets, passes and the mouths of rivers bays and harbors, affect the natural near shore flow of sediments. They also often represent political/economic boundaries which occasionally limit the lateral extent of beach replenishment projects. The ebb tidal deltas associated with some of these features often serve as the sediment source for beach replenishment. Reaches in the Big Bend of Florida are less easily defined as beaches there are discontinuous and frequently man-made or substantially modified. The defined reaches, i.e. beach segments tied to sample site locations, are delineated in Table 1. Grab samples of beach sediments are referred to as “beach samples”. The individual sites selected for the collection of multiple beach samples are referred to as “beach sampling locations”. The beach sampling locations utilized are shown in Figure 1 and listed in Table 2. Individual sampling points within those locations are specified by their place on the beach profile. Photographs of individual beach samples can be found in Appendix A. Sediment analysis conducted to characterize a beach sample’s grain size distribution is referred to as “granulometric analysis”. This analysis is graphically displayed on grain size distribution (GSD) curves. These curves, created from beach samples, can also be found in Appendix A. The sediment fraction referred to as “fines” is that material which will pass through a 4.00 phi, 0.0025 inch (63 micron) mesh opening (# 230 sieve). Surveyed beach monument locations are established by the Bureau of Beaches and Coastal Systems (BBCS) of the Florida Department of Environmental Protection (FDEP) at approximately 1,000 foot intervals for the purposes of beach monitoring and management, and are an established reference feature in the study area. This study sampled the beach adjacent to every fifth beach monument. Table 4 ties these monument points to beach sampling locations. |
Contents of this DiskThe contents of this disk include the written
report as well as a number of figures, tables, and appendices which
can be navigated through independently of the report; however,
it is highly recommended that you refer to the main body of the
report for further information concerning the specific data found on
the disk. Appendix A includes photos,
descriptions, and grain size analyses of beach samples, as well as
photos of beach sampling locations.
Appendix B discusses quality control, while
Appendix C compares the grain
size analyses of samples near inlets.
Appendix D is a collection of
photomicrographs of select samples, and
Appendix E is a
slideshow summary of the project. |
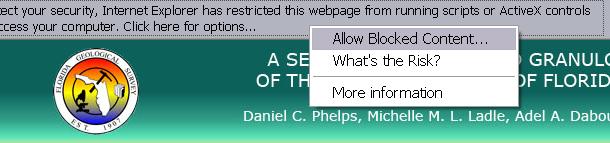
Accessing the DataThe contents of this disk can be accessed via the DVD Index Page or the written report, which can be accessed from both the DVD Index as well as the sidebar throughout the webpages on the disk. A large number of files are in PDF format and Adobe Acrobat Reader is required to view them. To view the webpages correctly, you may have a security warning popup. By selecting "Allow Blocked Content," your computer will enable the javascript that has been included in the disk. |
 |
DisclaimerThis geologic data was developed by the Florida Department of Environmental Protection (FDEP) - Florida Geological Survey (FGS) to carry out agency responsibilities related to management, protection, and development of Florida's natural resources. Although efforts have been made to make the information accurate and useful, the FDEP/FGS assumes no responsibility for errors in the information and does not guarantee that the data are free from errors or inaccuracies. Similarly FDEP/FGS assumes no responsibility for the consequences of inappropriate uses or interpretations of the data. As such, these digital data are distributed on an "as is" basis and the user assumes all risk as to their quality, the results obtained from their use, and the performance of the data. FDEP/FGS bears no responsibility to inform users of any changes made to this data. Anyone using this data is advised that precision implied by the data may far exceed actual precision. Comments on this data are invited and FDEP/FGS would appreciate that documented errors be brought to staff attention. The development of these data sets represents a major investment of staff time and effort. As a professional responsibility, we expect that the FDEP/FGS will receive proper credit when you utilize these data sets. Further, since part of this data was developed and collected with U.S. Government or State of Florida funding, no proprietary rights may be attached to it in whole or in part, nor may it be sold to the U.S. Government or the Florida State Government as part of any procurement of products or services. |